
Should I have a transplant? Using flexible parametric models to predict survival after kidney transplant waitlisting
Georgina Irish1,2,3, William Mulley4,5, Philip A. Clayton1,2,3.
1ANZDATA, ANZDATA, Adelaide, Australia; 2Department of Nephrology, Monash Medical Centre, Clayton, Australia; 3Central and Northern Adelaide Renal and Transplantation Service, Royal Adelaide Hospital, Adelaide, Australia; 4Health and Medical Sciences , The University of Adelaide , Adelaide, Australia; 5Centre for Inflammatory Diseases, School of Clinical Sciences, Monash University, Clayton, Australia
Transplant Epidemiology Group (TrEG).
Background: The Cox proportional hazards model is commonly used to compare survival between the waiting list (WL) and after deceased donor kidney transplantation (TP). However, the Cox model only allows estimation of relative but not absolute survival. Flexible parametric models (FPM) solve this by modelling the baseline hazard which enables the creation of an absolute survival prediction for individuals with different characteristics.
Aims: To develop FPMs for predicting survival on the waiting list versus deceased donor kidney transplantation.
Methods: Using the Australia and New Zealand Dialysis and Transplant (ANZDATA) Registry, we included Australian adults waitlisted for first kidney-only deceased donor transplants over 2007-2020. We developed FPMs for waitlist and post-transplant survival. Covariates were decided using backwards elimination and the baseline hazard function was modelled using cubic splines.
Results: 7552 patients were included in this analysis: 5429 (72%) received a deceased donor kidney transplant. The models were adjusted for age, gender, primary kidney disease, dialysis duration, comorbidities, and smoking status. The FPM allowed calculations of individual mean life expectancy (Figure 1).
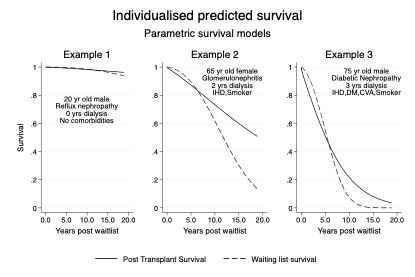
Example 1, TP: 69 years (95% CI 63-75), WL: 41 years (95% CI 15-67), Difference: 28 years.
Example 2, TP: 17 years (95% CI 13-22), WL: 9 years (95% CI 7-10), Difference: 8 years.
Example 3, TP: 4 years (95% CI 3-6), WL:4 years (95% CI 3-5), Difference: 0.5 years.
Conclusions: FPM can predict risk for patients on the kidney transplant waitlist. For the first time, this enables absolute survival prediction, to help patients and clinicians understand the likely outcomes of transplantation vs remaining on dialysis. The next step will be model validation and incorporation of quality-of-life utilities.

right-click to download