
Population model confirms predictable pharmacokinetic (PK) and pharmacodynamic (PD) profile for apraglutide: data from two randomized phase 1 studies
Federico Bolognani1, Matthias Machacek2, Annelieke Kruithof3, Marieke de Kam3, Kirsten Bergmann3, Max van Gent3, Matthias Moerland3, Pascal Crenn4, Christian Meyer1, Gerard Greig1, Pim Gal3, Pascal Schulthess2.
1VectivBio, Basel, Switzerland; 2Lyo-X GmBH, Allschwil, Switzerland; 3Centre for Human Drug Research, Leiden, Netherlands; 4Université Paris Saclay APHP, Paris, France
Background: Apraglutide, a novel long-acting glucagon-like peptide-2 (GLP-2) analogue that promotes intestinal growth in animals and increases intestinal absorption, is in Phase III development for the treatment of short bowel syndrome with intestinal failure (SBS-IF). Pharmacokinetic (PK) and pharmacodynamic (PD) characterization revealed a predictable linear PK distribution and elimination kinetics and a dose-dependent PD relationship. A model was created to enable characterization of PK and PD relationships at the population level using plasma citrulline, a biomarker of small intestine functional enterocytic mass.
Methods: A population PK/PD model was created by combining PK and citrulline data from two randomized, placebo-controlled, Phase I studies of apraglutide in healthy adult volunteers. In Study 1, 64 volunteers received either a single ascending dose of apraglutide (2.8, 5.7, 11.4, 28.4, or 56 mg), 3 weekly doses of apraglutide (11.4, 28.4, or 56 mg) or placebo by subcutaneous (SC) injection. In Study 2, 24 volunteers received 6 weekly SC administrations of apraglutide (1, 5 or 10 mg) or placebo. A one-compartmental structural model with zero-order absorption and linear clearance was used to describe apraglutide PK. Plasma citrulline levels were described by a turnover model with a synthesis and degradation rate. The effect of apraglutide on citrulline synthesis was modeled with a stimulatory effect on the citrulline synthesis rate using an Emax relationship. Population PK and PD parameters were estimated using the stochastic approximation of expectation-maximization algorithm (Monolix Suite 2019 R1). Inter-subject variability was modelled using log-normal distributions. Simulations included the impact of covariates.
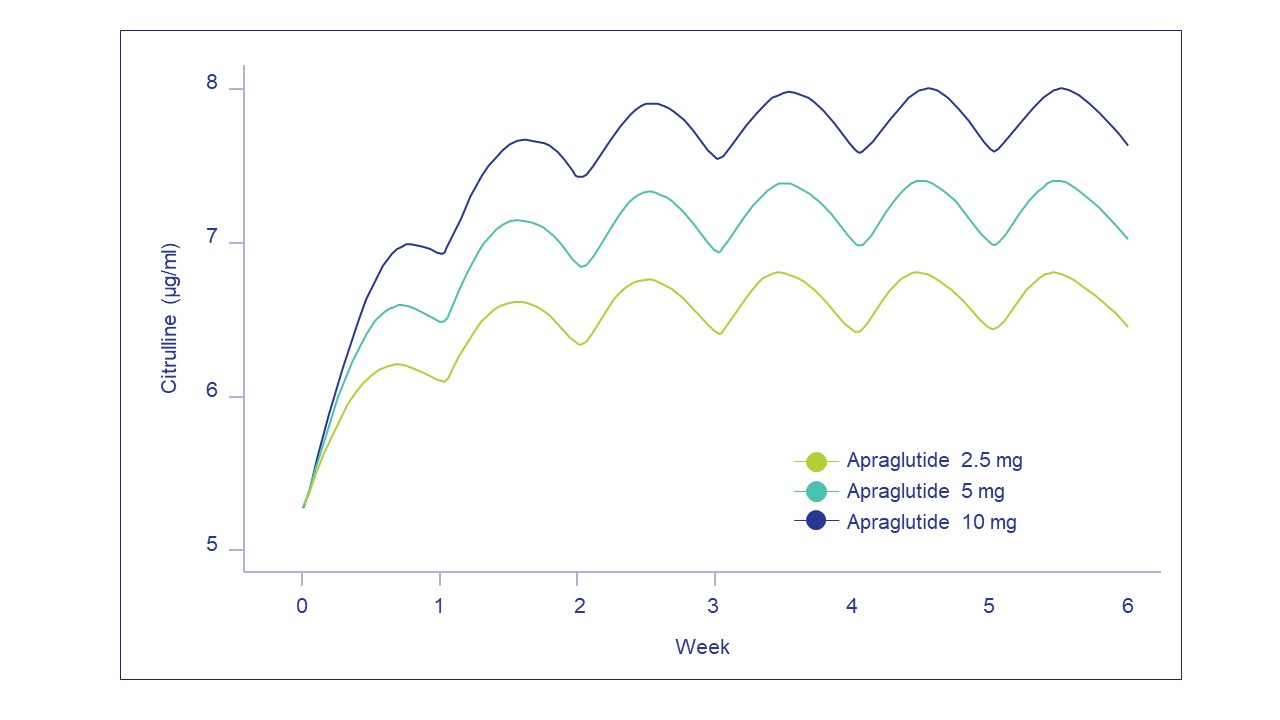
Results: Actual PK observations were best matched by a population PK/PD model with a dose covariate on absorption duration and body weight covariates on V1/F and Cl/F. The parameter estimates for a 70-kg individual receiving apraglutide 5 mg SC were an apparent volume of distribution of 31.3 L and time to maximal concentration (T ) of 1.39 days. Simulated PK and PD profiles with weekly apraglutide 2.5, 5, or 10 mg sc are shown in Figure 1. The PK/PD model did not indicate any accumulation of apraglutide over time for a weekly administration. Although accumulation of citrulline was apparent during the first 3 weeks of treatment, a steady state concentration was subsequently reached.
Conclusions: This population PK/PD model enables prediction of the effect of different apraglutide doses on plasma citrulline levels as well as the impact of covariates, such as body weight, at the population level. This further demonstrates apraglutide’s predictable PK profile with no accumulation during once weekly sc dosing and its ability to induce a dose-dependent citrulline increase.

right-click to download