
Changes in the kidney allocation model in Uruguay - HLA compatibility vs. time on waiting list
Adriana Tiscornia1, Mariana Lorenzo1, Sebastian Marton1, María Saravia1, Gustavo Boksar1, Gonzalo Fernandez1, Karina Rodriguez1, Milka Bengochea1.
1Immunogenetic and Histocompatibility Lab, INDT, Montevideo, Uruguay
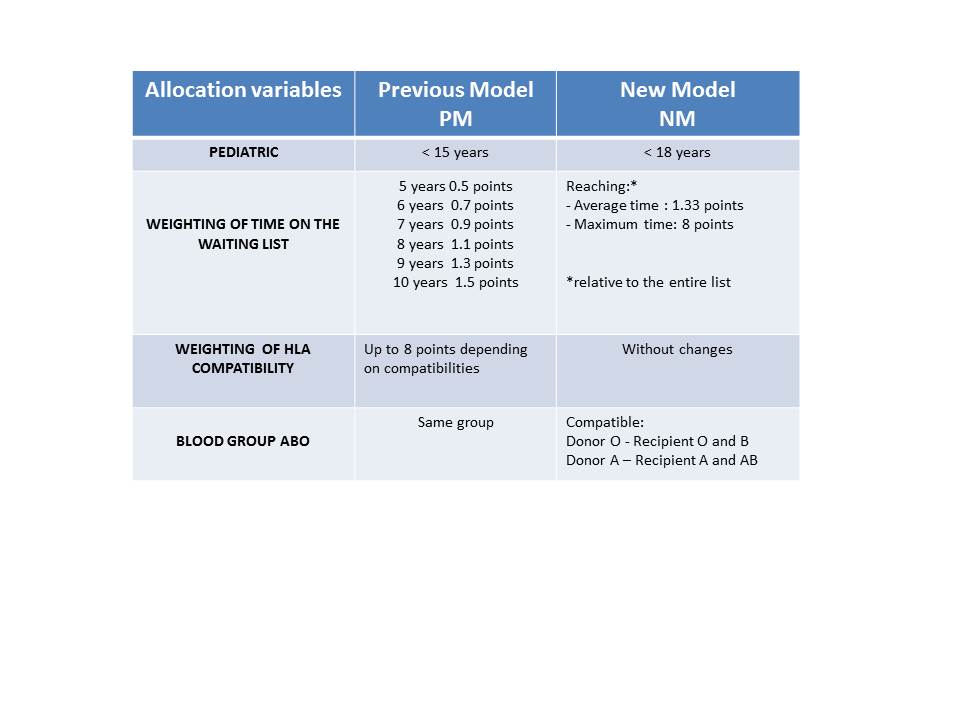
Introduction: The Instituto Nacional de Donación y Trasplante (INDT) implemented two years ago the new kidney allocation model (new model -NM), previously evaluated with mathematical model that allowed to simulate scenarios and evaluate the impact on allocations. The NM maintains a mixed flow and scoring system as the Previous model (PM), but establishes changes in ABO compatibility and the weighing of: time wait list (TWL), HLA compatibility and donor (D) and recipient (R) age (Table 1). The aim of this work is to characterize and compare the groups of patients assigned under both models (NM and PM), in relation to: recipient age, TWL, ABO compatibility and HLA compatibility score.
Methods: The population studied included the recipients assigned during 1/2018-02/2020 (PM) and during 03/2020-03/2022 (NM) which were obtained from the database of the INDT´s Assignment Unit (Table). We reviewed the following variables of 1st and 2nd recipients assigned: D and R ABO , R age, TWL, and HLA compatibility recorded as numerical value. Variables categorized were: age (0-18 /19-60/over 61 years), ABO compatibility with donor (isogroup/compatible). Statistic analysis was applied.
Results: Total allocation records analysed were N=405, 205 corresponding to PM and 200 to NM. With the new model, 25(12%) compatible ABO recipients were assigned, while in PM all allocations were ABO isogroup. NM allocated patients with higher WLT than PM (U13887, p<0.05- Mann Whitney U test). NM allocated patients with lower HLA compatibility score than PM (D=0.3145, p<0.05, Kolmogorov-Graph). Age range comparison did not show differencies (p > 0.05 Chi-square 11.8176).
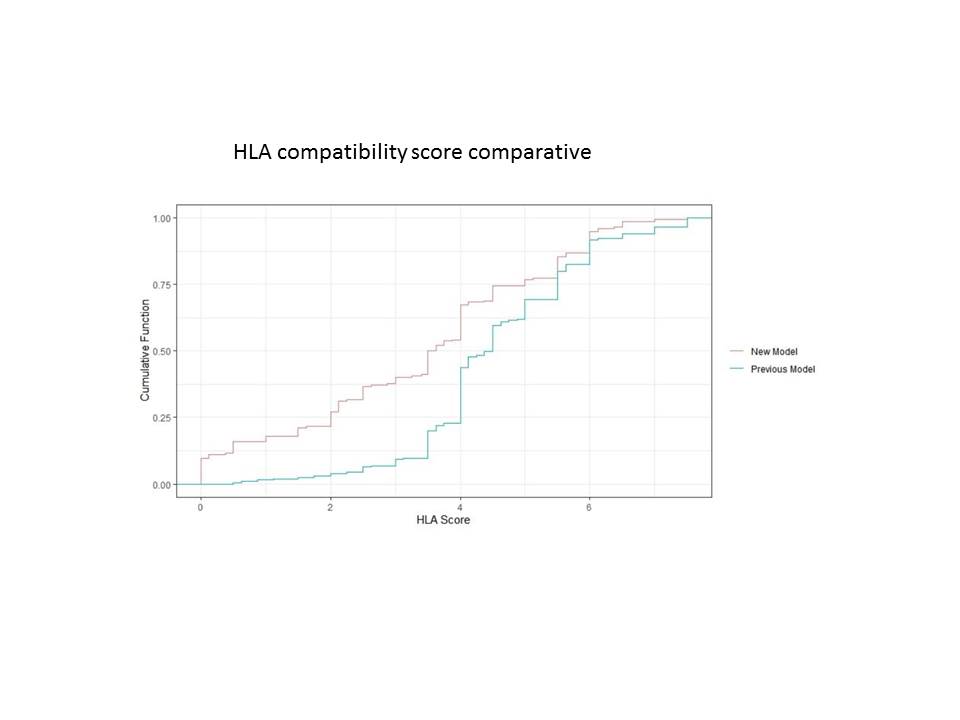
Conclusions: The comparative analysis of both models shows differences in HLA compatibility and TWL in recipients assigned. The decrease on HLA compatibility score is explained in the first two years of NM implementation by the allocation on patients with long TWL.
right-click to download