Live donated kidneys don't behave like the one left behind
Heidi Sarumi1, Scott Jackson 1, Timothy L. Pruett1.
1Solid Organ Transplant Surgery, University of Minnesota, Minneapolis, MN, United States
Introduction: Following live kidney donation (LD), the donor glomerular filtration rate (GFR) increases for the initial 5 years1, especially in younger donors. We queried whether the recipients of younger LD kidneys would have a similar eGFR increase.
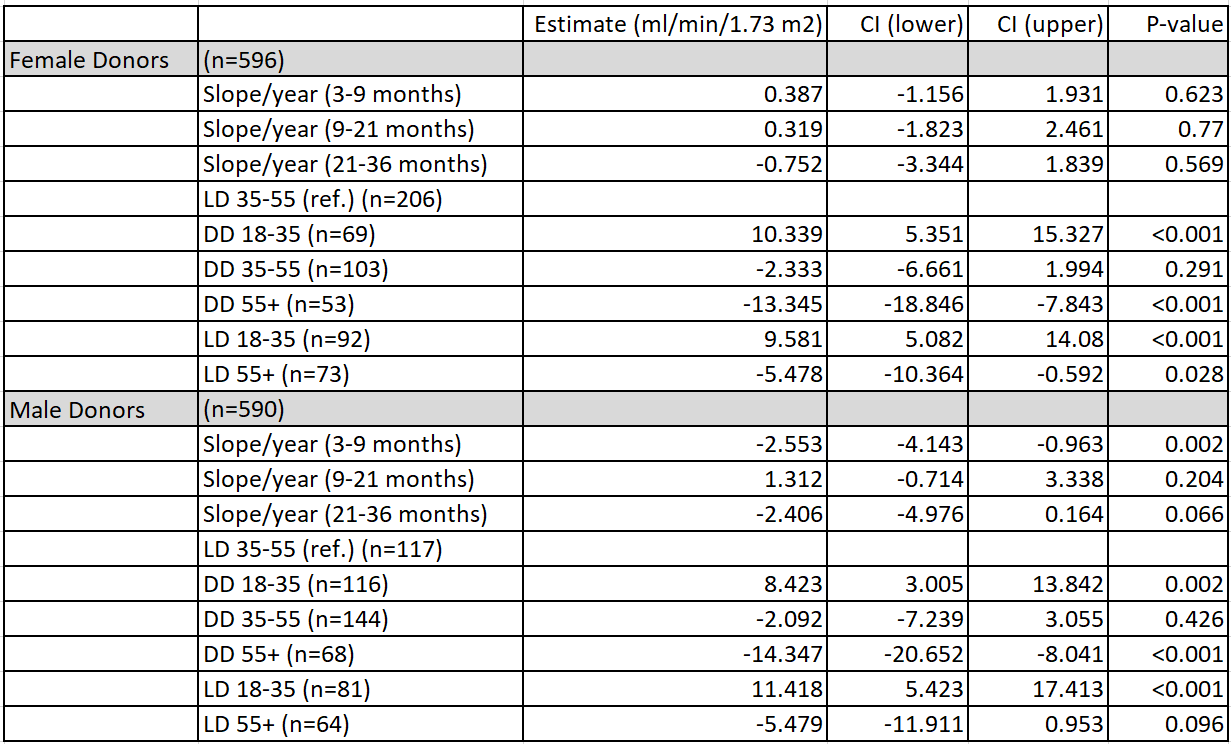
Methods: The medical records of primary LD and DD adult kidney alone recipients at a single center performed between 1/1/10-6/30/21 were analyzed. 62,371 eGFR calculations (CKD-EPI) were available between 3-36 months post-transplant for 1186 recipients. Restricted cubic splines were used to analyze the trajectory of eGFR from 3-36 months post-transplant recipients of kidneys from donors 18-35, 35-55 and >55 years. Slopes were constructed separately from 3-9, 9-21 and 21-36 months. A mixed effects model was utilized to calculate predicted eGFR for donor type/age group, separately for male and female donors (21 additional recipients excluded due to lack of donor gender data). An analysis adjusting for BSA was completed with similar results. Model results are presented in Table 1. All analyses were performed in R, ver. 4.1.1.
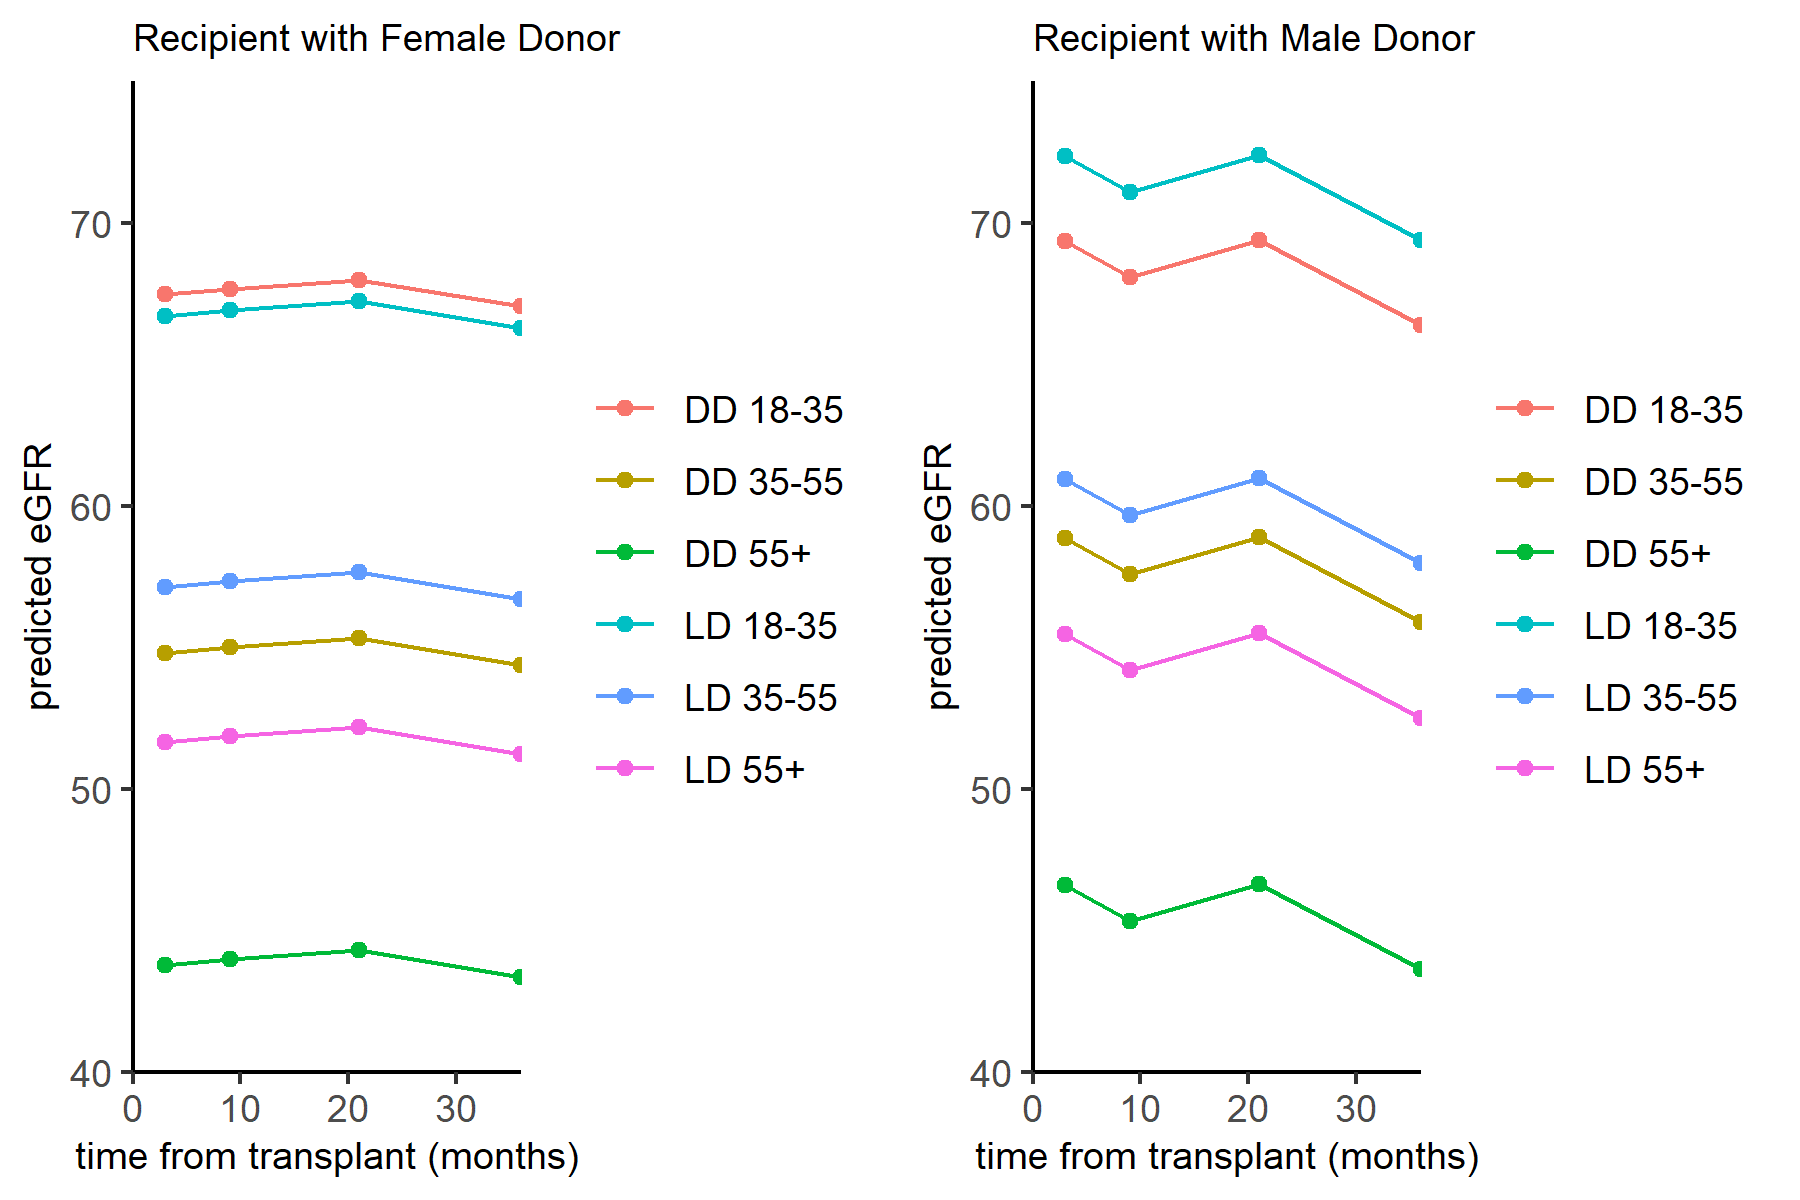
Results: The eGFR varied by donor age and gender. Kidneys (DD and LD) from women on aggregate provided lesser eGFR than male donors (Table 1). However, predicted eGFR change was similar when grouped by gender and age of DD and LD kidneys. Compared to recipients of LD aged 35-55, DD kidneys 18-35 years had an eGFR +10.339 mL/min/1.73m2 from female donors and +8.423 mL/min/1.73m2 difference from males. For DD 35-55 years, -2.333 mL/min/1.73m2 difference from females and -2.092 mL/min/1.73m2 from males, with a larger difference in the LD >55 year age group -5.478 mL/min/1.73m2 difference with females and -5.479 mL/min/1.73m2 difference with males. In a separate analysis, no observed differences in the rate of eGFR change was noted from recipient age, gender or race. The p-values (Table 1) are based on an eGFR difference from 0 mL/min/1.73m2, many p-values while statistically significant, may not be clinically significant.


Gender is significant. Males tend to have more kidney mass and greater BSA. If the recipient is a female and the donor a male, a higher eGFR is expected, conversely in a male receiving a female kidney. 59.7% of the recipients of female kidneys were male. Of the recipients of male kidneys, 56.4% were male. Overall, a slightly higher eGFR in recipients of male kidneys at 3 months and 3 years was observed.
Conclusion: The post-donation increase of eGFR observed after live kidney donation did not occur in the recipients of LD kidneys. The overall trajectory of LD and DD kidney transplant eGFR during the first 3 post-transplant years is similar within the age/donor type groups. Donor age and gender (more likely amount of renal mass) are important factors determining eGFR.
1. Matas AJ, Vock DM, Ibrahim HN. GFR ≤25 years postdonation in living kidney donors with (vs. without) a first-degree relative with ESRD. Am J Transplant. 2018;18:625–631.
