The Impact of UNOS Acuity Circles-Based Organ Allocation on DCD Liver Transplant Rates and Waitlist Mortality in the United States
Emmanouil Giorgakis1, Tommy Ivanics2, David Wallace3, Lyle Burdine1, Raj Patel1, Mary K Rude1, Julius Balong1, Allison Wells1, Derek Krinock1, Hailey Hardgrave1, Andrew Singer4, Amit Mathur4.
1Transplant, UAMS, Little Rock, AR, United States; 2Transplant, UHN, Toronto, Canada; 3Institute of Liver Studies, King's College Hospital, London, United Kingdom; 4Transplant, Mayo Clinic, Phoenix, United States
Background/ Aim: The acuity circles -based liver allocation policy (AC) has aimed to shift ideal donor livers from “lower MELD” to “higher MELD” regions, which could have variable geographic effects on waitlist outcomes and organ acceptance of marginal allografts, such as those from donors after circulatory death (DCD). We aimed to explore how AC affected DCD liver transplantation (LT) and waitlist mortality (WLM) across the United States.
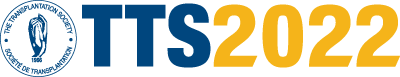
Method: Study period: 01/2016- 08/2021. Waitlist and transplant datasets were retrieved from the Scientific Registry of Transplant Recipients. All adult DCD LTs were included. The cohort was dichotomized into pre-AC (01/2016-02/2020) and post-AC eras (02/2020-08/2021). Annual state-based DCD LT rates were calculated as a function of waitlist size (the number of DCD LTs/ waitlisted patients/year), and waitlist mortality (WLM) was calculated as the number of waitlist removals due to death over the number of patients on the waitlist per State/ year. State-based differences (Δ) in DCD rate (ΔDCD) and WLM rate (ΔWLM) were measured pre- and post-AC.
Results: AC implementation coincided with an increase in the overall LT activity (average 8229 LT/ year pre-AC vs. 8873 in 2020), and overall DCD LT (average 552 DCD LT/year pre-AC vs. 830 in 2020). Following implementation of the new allocation policy (table 1):
Overall waitlist mortality remained unchanged (9%, range -10 to 13%). Overall DCD transplant rate shifted from 6% to 8% (NS), with tremendous variation among States (ΔDCD range -1% to +14%). The sharpest increase was noted in Arkansas (14%), followed by Louisiana (5%), Arizona (4%), and Mississippi (4%). The highest absolute DCD rate was met in Arkansas (36%), followed by Arizona (31%), with respective ΔWLM of -3% and 0%. Southern States had a median increase of their DCD rates (ΔDCD) 2 (IQR 1, 4; range 14) with a median increase of their WLM by 0.5% (IQR -0.5%, 2%). Coastal States had a median ΔDCD of 1(IQR 0,1; range 3) with a median increase of their WLM by 1.5% (IQR -1%, 3.5%)
Conclusion: The post-AC era was associated with no significant differences in WLM overall but varied tremendously across states. State-based differences in DCD LT were notable post-AC, particularly in the South and Southwest. This study suggests that the AC policy has had geographically variable impact on waitlist outcomes and DCD LT use. Better understanding of center practices and outcomes in the post-AC era is critical to evaluate the impact of organ allocation policy changes on stakeholders.
right-click to download