Pretransplant kidney transcriptome captures immune pathways and predicts 24-month outcomes
Elissa Bardhi1, Kellie Archer2, Daniel Maluf3, Jennifer McDaniels1, Thomas Rousselle1, Lorenzo Gallon4, Enver Akalin5, Thomas Mueller6, Valeria Mas1.
1Department of Surgical Sciences, University of Maryland School of Medicine, Baltimore, MD, United States; 2Division of Biostatistics, College of Public Health at Ohio State University, Columbus, OH, United States; 3Department of Surgery, University of Maryland School of Medicine, Baltimore, MD, United States; 4Department of Medicine-Nephrology, Northwestern University, Chicago, IL, United States; 5Kidney Transplant Program, Albert Einstein College of Medicine, Bronx, NY, United States; 6Division of Nephrology, University Hospital Zürich, Zurich, Switzerland
Introduction: The field of transplantation is in critical need of more accurate tools to predict allograft outcomes. A transcriptomic profile serves as a snapshot of the temporary cell state and thus, analyzing pretransplant kidney biopsies can provide detailed information on the early biological processes associated with posttransplant outcomes. Currently, there are no established predictive biomarkers for posttransplant kidney function.
Methods: Gene expression measurements were performed using Affymetrix GeneChip microarrays (HG-U133A 2.0) in the training set (n=174). Patients with low function had an eGFR <45 mL/min/1.73m2 (avg slope = -6.36 ml/min/1.73m2/year) and those with high function had an eGFR ≥45 mL/min/1.73m2 (avg slope= 0.81 ml/min/1.73m2/year) at 24 months. To identify differentially expressed genes (DEGs) and clinical characteristics associated with 24-month graft function, linear models were fit adjusting for surrogate variables. The performance of DEGs and clinical characteristics was assessed using the area under receiver operating characteristic curves (AUROC). A subset of candidate genes was measured in an independent set of pretransplant biopsies (n=96) using qPCR. A risk score equation was derived from the predictive model and performance was compared to KDPI.
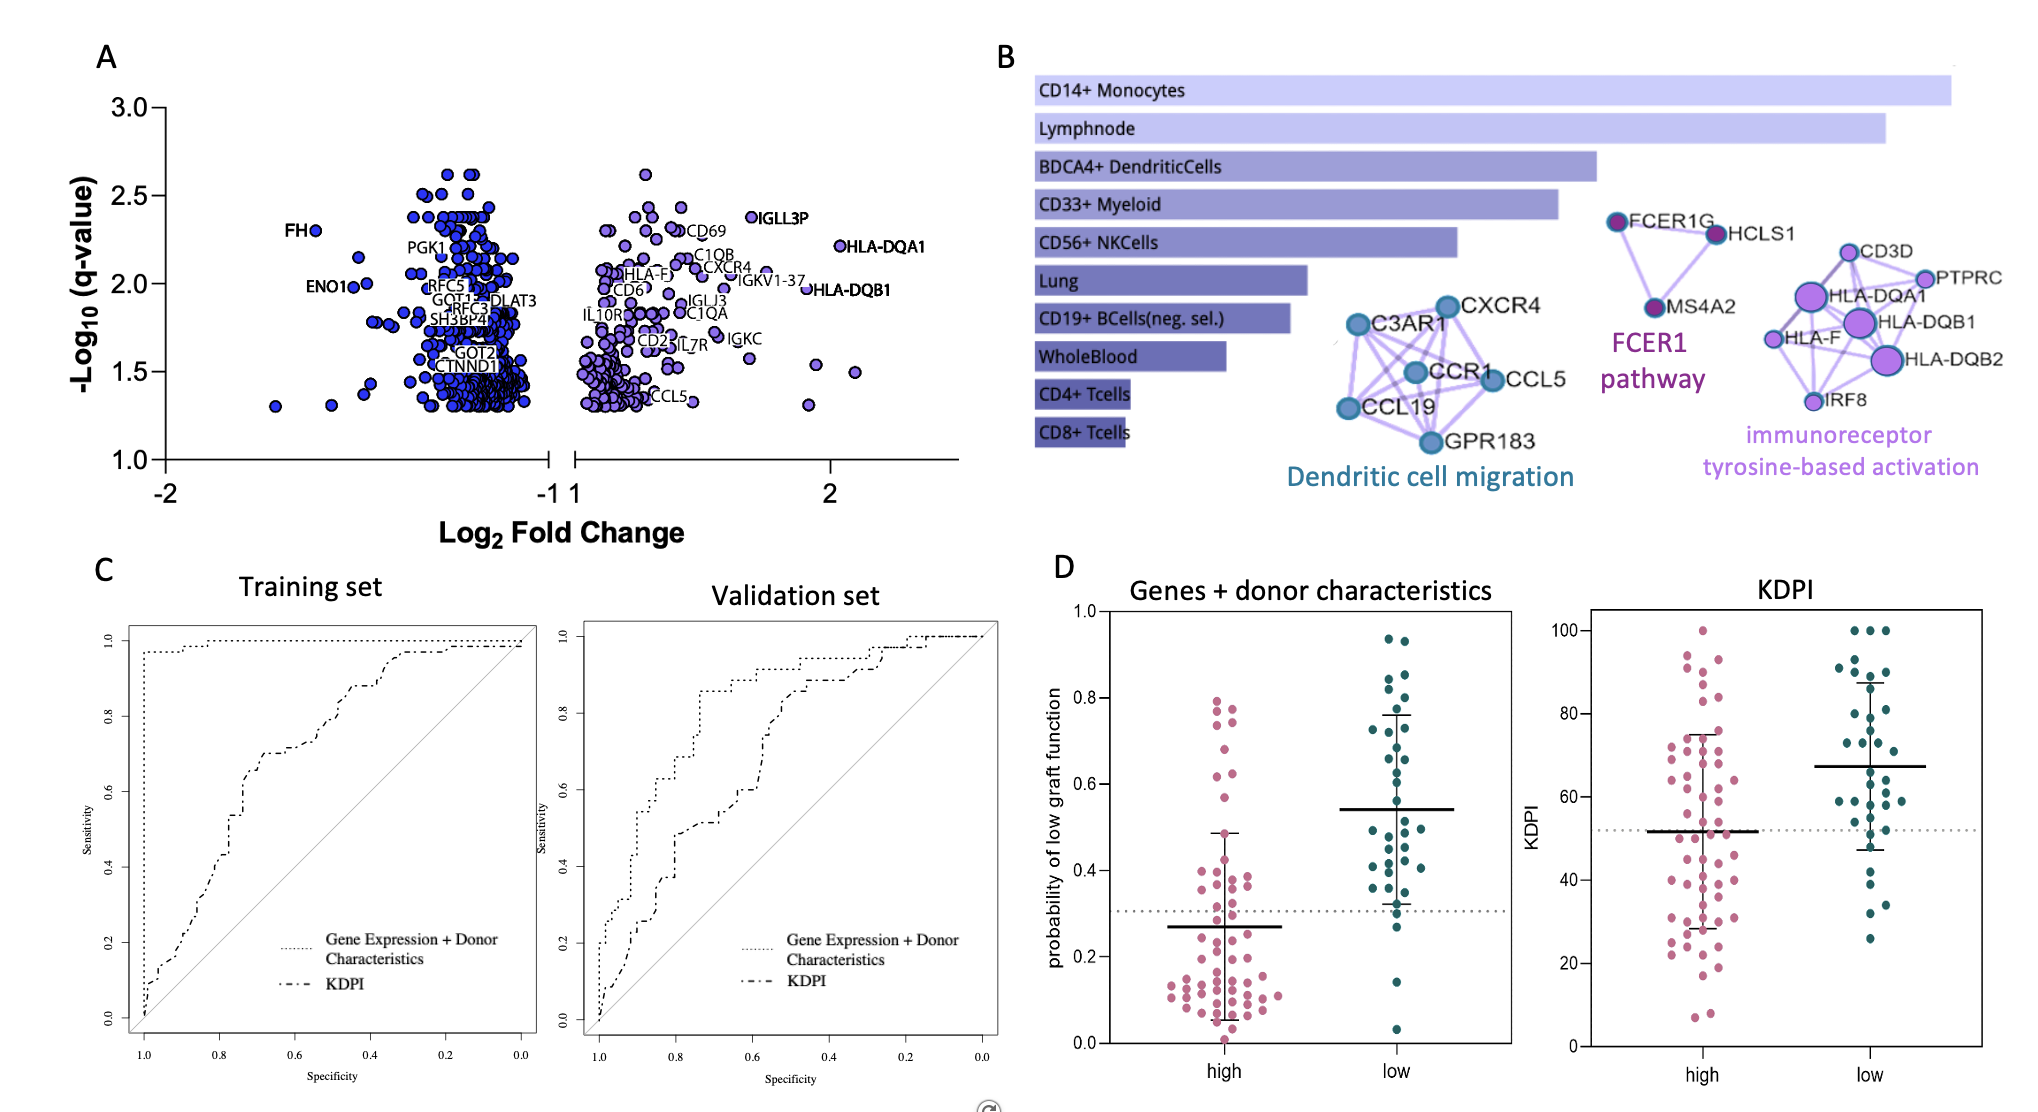
Results: Donor age, race, and BMI correlated with 24-month function (p<0.05). No recipient characteristics were statistically significant between groups. Nearly 700 DEGs were found to be associated with 24-month outcomes (FDR<0.05). Grafts with low 24-month function showed upregulated genes related to immune responses (e.g., CD3D, CD69, CCL5, CXCR4, C1QB, FCER1G, ILR7) and downregulated genes related to metabolic/tubular functions (e.g., ENO1, FH, POGK, SLC22A8, SL4A4, WDR1) (Fig 1A). Cell-type enrichment analyses identified monocytes, dendritic, myeloid, and natural killer cells as the main cell sources for the upregulated genes (Fig 1B). Using a 55 gene model adjusted for donor age, race, and BMI resulted in an AUROC=0.996 (KDPI AUROC=0.705). In the validation set, 13 genes + 3 donor characteristics (G+D) achieved an AUROC=0.821 (KDPI AUROC=0.691) (Fig 1C). Using a probability equation derived from the G+D model to predict low 24-month function, the sensitivity was 88.9% and the specificity was 66.6%. When using KDPI, the sensitivity was 80.6% and the specificity was 53.3% (Fig 1D).
Conclusion: This study represents the largest high-throughput transcriptomic analysis of pretransplant donor kidneys predicting 24-month outcomes. A predictive risk score was developed, which combines donor age, race, BMI, and donor quality gene markers, and can be calculated prior to transplantation to predict graft function. Differential pretransplant transcriptional profiles between kidneys with low and high function at 24-months were also identified, providing a deeper insight into the early biological processes leading to graft dysfunction.

Research reported in this abstract was supported by National Institute of Diabetes and Digestive and Kidney Diseases (NIDDK) of the National Institutes of Health under awards numbers: R01DK109581 and R01DK122682.

right-click to download
