
The impact of donor body mass index on graft survival after living kidney transplantation
Ciria Sousa1, Manuela Almeida2,4, Cátia Figueiredo3, Gonçalo Cruz5, Sofia Ventura2, Jorge Malheiro2,4, Sofia Pedroso2,4, Jose Silvano2, LaSalete Martins2,4.
1Nephrology, Centro Hospitalar de Trás-os-Montes e Alto Douro (CHTMAD) - Vila Real, Portugal, Vila Real, Portugal; 2Nephrology, Centro Hospitalar Universitário do Porto, Porto, Portugal; 3Nephrology, Centro Hospitalar do Médio Tejo, Torres Novas, Portugal; 4Unit for Multidisciplinary Research in Biomedicine , Instituto de Ciências Biomédicas Abel Salazar – Universidade do Porto (ICBAS-UP), Porto, Porto, Portugal; 5Nephrology, Hospital Garcia da Orta, Almada, Portugal
Introduction: As the obesity epidemic worsen, kidney transplant (KT) candidates are also more obese as well as their potential living and deceased donors (DD). Increased scarcity of organs makes it necessary to adjust the acceptance criteria and has led to the acceptance of living donors (LD) that were previously declined. Many studies found that donor and recipient obesity are significantly related to a decreased graft and patient survival on both living and DD kidney transplant. We aimed to investigate the impact of donor body mass index (BMI) on graft in a cohort of recipients of living kidney transplant (LKT).
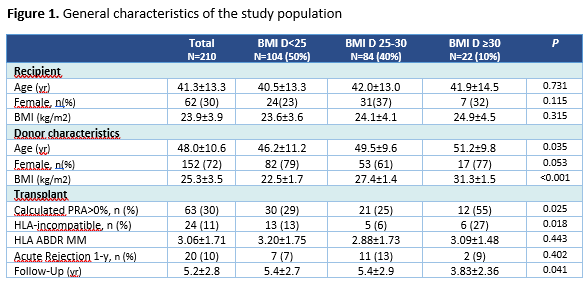
Methods: This is a unicenter retrospective observational study that included LKT between 2008 and 2017. Several clinical data were analyzed as depicted in table1, including the number of acute rejections at the first year, and the graft glomerular filtration rate (eGFR) during the follow-up time (CKD-EPI equation). We grouped donors based on their calculated BMI as follows: <25, 25–30, ≥ 30 kg/m2. The Kaplan-Meier curves and Cox proportional hazards regression were used for survival analysis and linear mixed regression was used to evaluate the slope of recipient eGFR over time, according to BMI groups.
Results: We observed 210 LKT. Mean follow up time was 5.2±2.8years. The mean age of recipients and donors was 41.3±13.3 and 48.0±10.6, respectively. Thirty percent of recipients and 72% of donors were female. Donors had a mean BMI of 25.3±3.5kg/m2. The mean eGFR among donors was 100.1ml/min/1.73m2(SD14.2) at the time of donation. Table 1 shows immunological features of the transplant. Censored graft survival rate at 8-years after transplantation was 92%, 84%, and 40% in recipients from donors BMI <25, 25-30 and ≥30, respectively. Overall graft survival at 8-years after KT was 92%, 79%, and 40% in BMI <25, 25-30 and ≥30, respectively (figure2)). BMI ≥30 (OR= 4,475; p=,035 vs BMI <25) was an independent predictor of censored graft survival in a multivariate analysis, besides acute rejection at 1-y (OR=3,639; p=,037), although none was statistical significant when global graft survival was considered. Comparing with donor BMI <25 kg/m2, a higher donor BMI was associated with a steeper annual decline in eGFR slope after one year after transplantation which difference were -1.0 [95% CI (-1.7)-(-0.3), p=,005] and -2.5 [(-3.9)-(-1.1), p<0.001], among donors with a BMI 25-30 and ≥30 kg/m2, respectively, compared to not overweight donors.

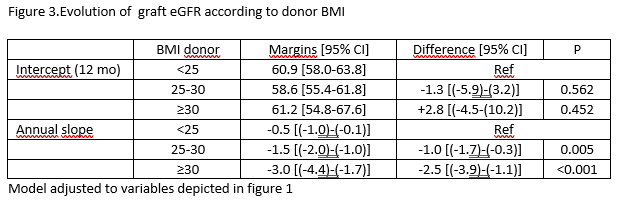
Conclusion: Donor obesity had an adverse impact on graft outcome after LKT in our population. This study also shows that slope in eGFR was superior in recipients of overweight donors (OD) in LKT. The selection of living OD must be careful because outcomes in this population seem worse, particularly for the obese. Further studies are necessary to establish adequate BMI cutoffs, that may help the decision for transplant professionals.

right-click to download